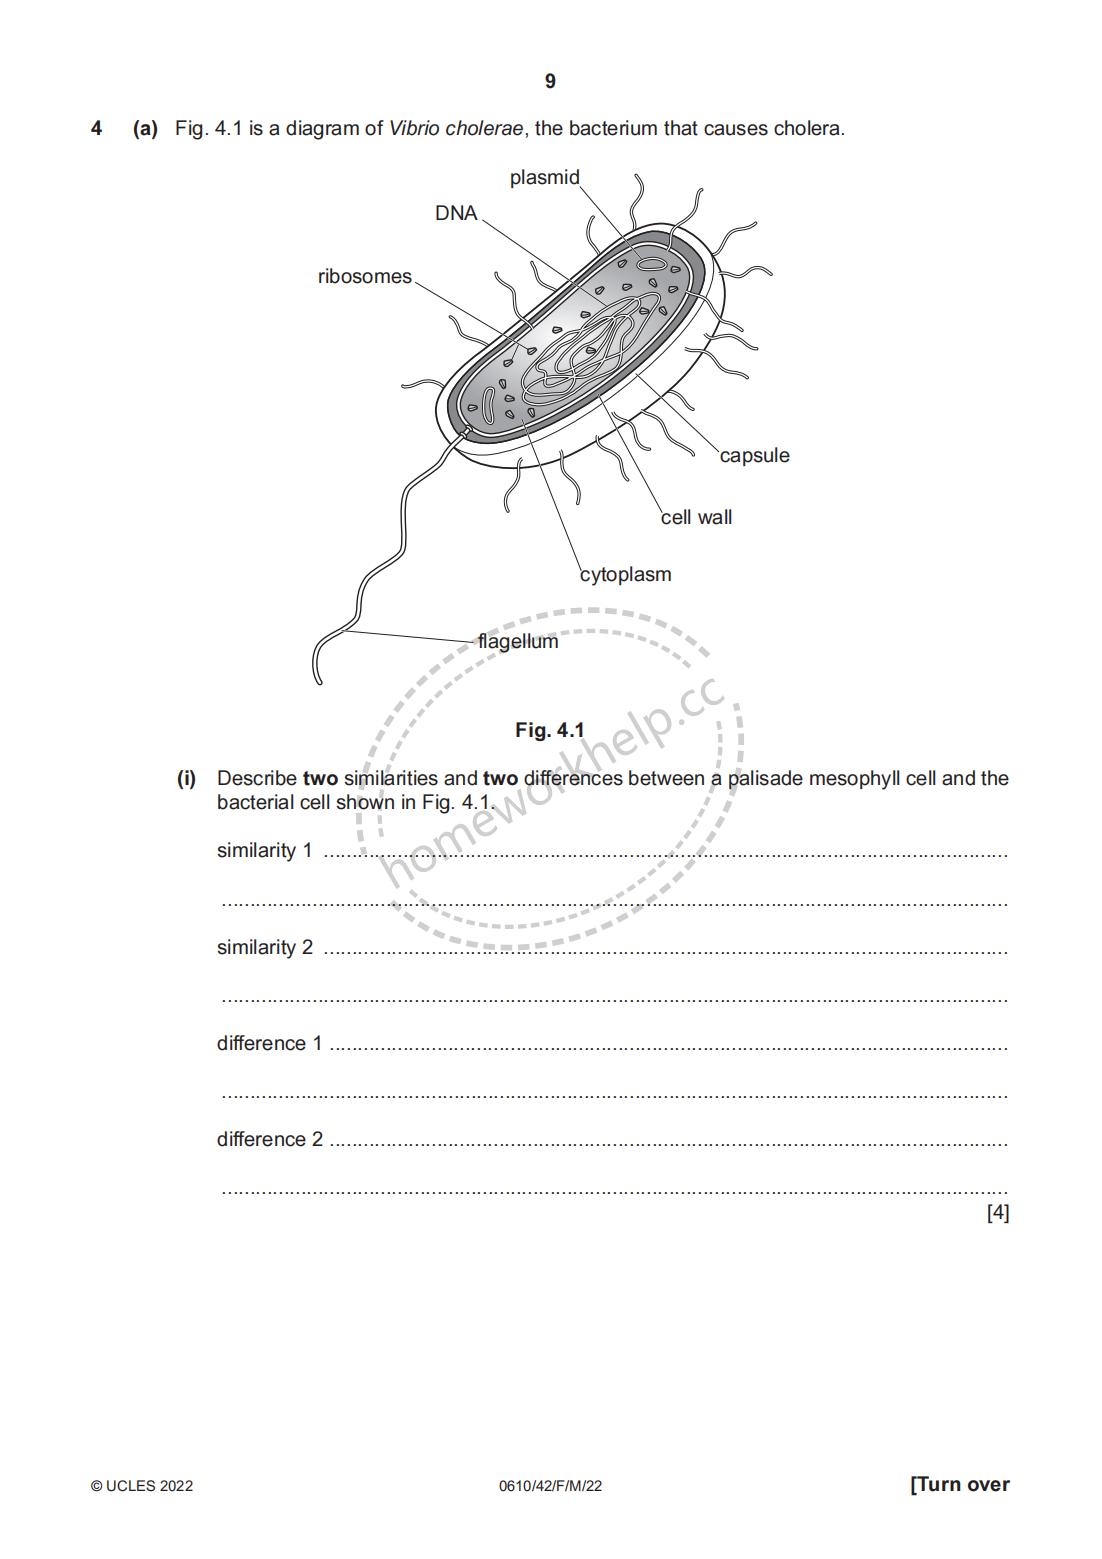
(a) Fig. 4.1 is a diagram of Vibrio cholerae, the bacterium that causes cholera.
Fig. 4.1
(i) Describe two similarities and two differences between a palisade mesophyll cell and the bacterial cell shown in Fig. 4.1.
similarity 1 .............................................................................................................
similarity 2 .............................................................................................................
difference 1 .............................................................................................................
difference 2 ............................................................................................................. [4]
(ii) Explain how the cholera bacterium causes diarrhoea.
.............................................................................................................
.............................................................................................................
.............................................................................................................
............................................................................................................. [3]
Image 9: 0610_m22_qp_42_09.jpg
(b) A scientist tested the resistance of one strain of bacteria to different antibiotics.
The scientist tested solutions of five different antibiotics, A to E.
She soaked a paper disc in each antibiotic solution.
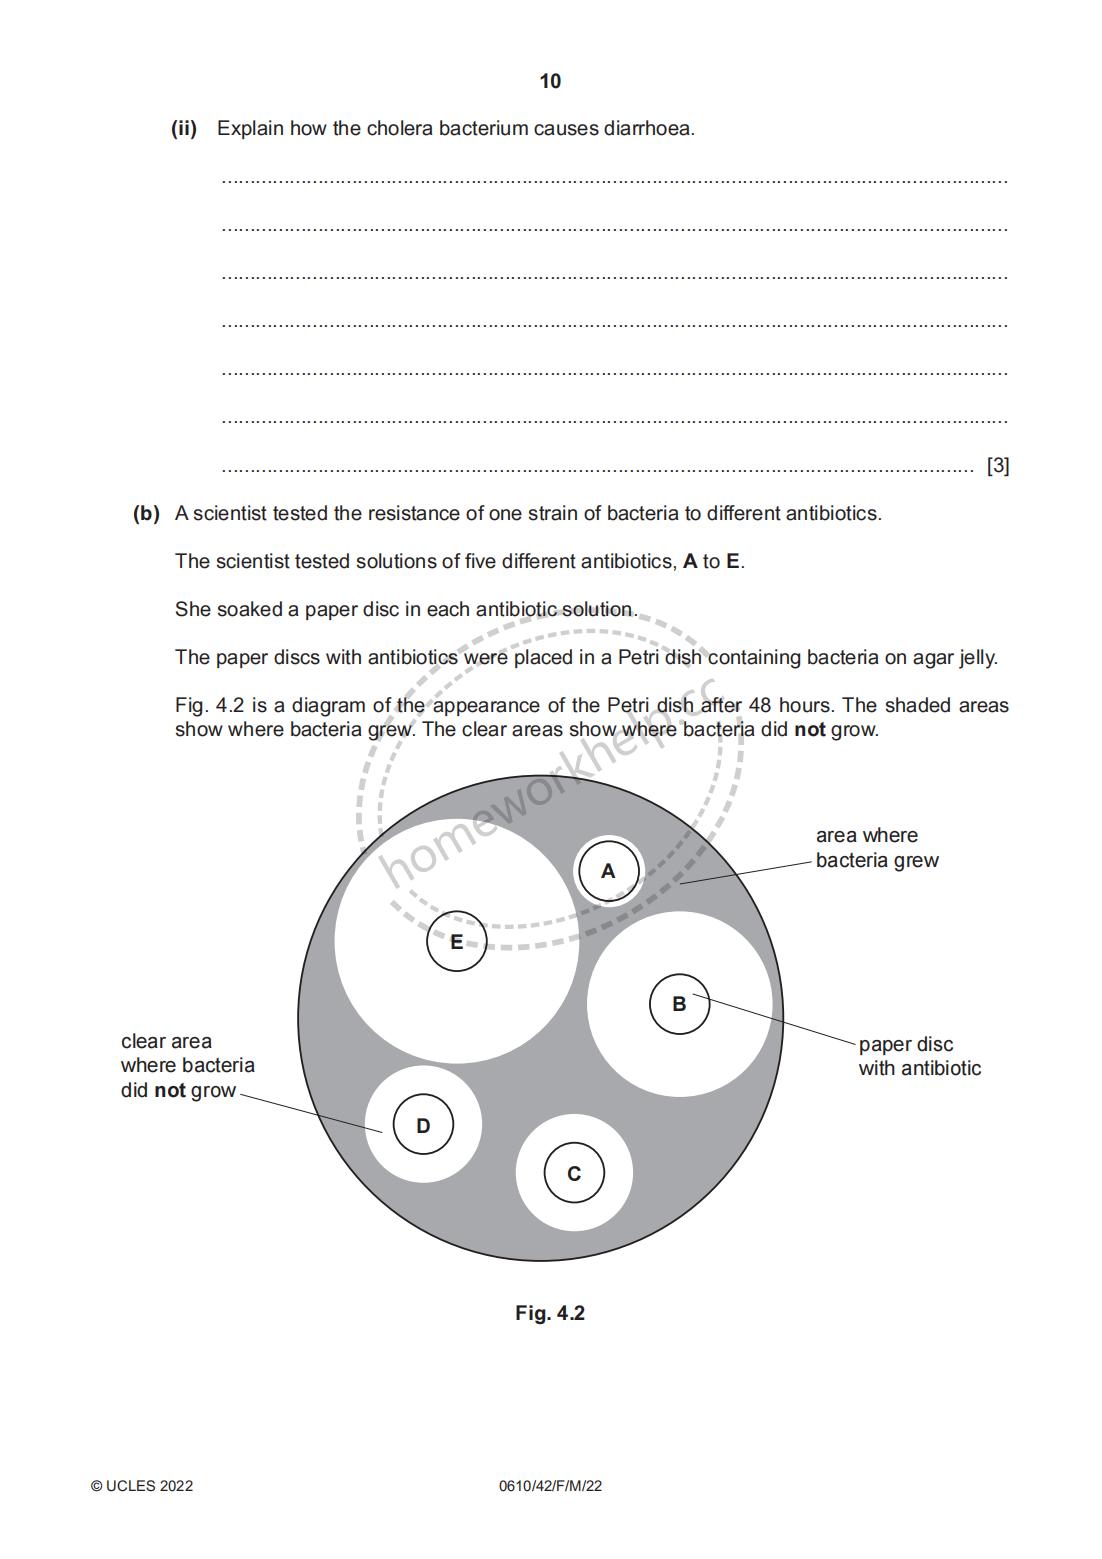
The paper discs with antibiotics were placed in a Petri dish containing bacteria on agar jelly.
Fig. 4.2 is a diagram of the appearance of the Petri dish after 48 hours. The shaded areas show where bacteria grew. The clear areas show where bacteria did not grow.
Fig. 4.2
(i) The strain of bacteria used in this investigation causes a disease. Using the information in Fig. 4.2, explain why antibiotic E would be the most effective at treating this disease.
.............................................................................................................
.............................................................................................................
.............................................................................................................
............................................................................................................. [1]
(ii) The results in Fig. 4.2 show that this strain of bacteria is resistant to antibiotic A.
Five years ago, a similar investigation found that the clear area for antibiotic A was the same size as antibiotic B is in Fig. 4.2.
Explain how bacteria become resistant to antibiotics.
.............................................................................................................
.............................................................................................................
.............................................................................................................
.............................................................................................................
.............................................................................................................
............................................................................................................. [4]
(iii) Describe how to minimise the risk of antibiotic B developing the same results as antibiotic A.
.............................................................................................................
.............................................................................................................
.............................................................................................................
............................................................................................................. [1]
[Total: 13]
Image 10: 0610_m22_qp_42_10.jpg
(a) Fig. 5.1 shows a food web in a habitat.
Fig. 5.1
(i) Name all the organisms in the food web in Fig. 5.1 that are in trophic level 3.
............................................................................................................. [1]
(ii) Describe how energy is transferred between trophic levels in the food web shown in Fig. 5.1.
.............................................................................................................
.............................................................................................................
.............................................................................................................
............................................................................................................. [2]
(b) Describe the ways in which energy is lost between trophic levels.
.............................................................................................................
.............................................................................................................
.............................................................................................................
.............................................................................................................
............................................................................................................. [4]
(c) Fig. 5.2 shows how the energy content of the living organisms in each trophic level in this habitat changes over time. The shaded areas show the energy content at the start of the study, and the unshaded areas show the energy content at the end of the study.
(i) Describe the changes shown in Fig. 5.2.
.............................................................................................................
.............................................................................................................
............................................................................................................. [3]
(ii) Suggest an explanation for the changes you have described in (c)(i).
.............................................................................................................
.............................................................................................................
.............................................................................................................
............................................................................................................. [3]


